Effect of Liner Hole Area on Small Gas Turbine Combustor Performance
This deep-dive presents a CFD-based investigation into how liner hole area (A_hole) influences total pressure loss, combustion efficiency, and exit temperature uniformity (pattern factor) in a small annular combustor. Secondary and dilution hole diameters were varied across four cases while the combustor reference area remained fixed.
Key findings: Larger liner holes reduce total pressure loss but slightly reduce combustion efficiency. Exit pattern factor shows no monotonic trend and depends strongly on dilution layout and combustor length.
Background: The Role of Liner Holes
The liner is perforated with families of holes that apportion compressor-delivered air among:
- Film cooling to protect metal surfaces.
- Primary/secondary injection to sustain the reaction and add momentum.
- Dilution to shape the exit temperature profile.
Hole area and distribution determine jet momentum, mixing length scales, wall heat transfer, and the eventual exit temperature profile.
Operating Point & Working Fluids
- Air inlet: 500 K, 5 bar
- Fuel inlet: 300 K, ATF
C12H23(surrogate) - Air mass flow: 1.715 kg/s; Air–Fuel ratio: 60
- Target exit (reference): ≈ 1100 K (NASA‑CEA, ideal adiabatic estimate)
Geometry & Configurations
A 1/6th annular sector (60°) was modeled with a simplex atomizer and a 50° vane-angle swirler. Four configurations were created by progressively reducing secondary and dilution hole diameters from Case 1 → Case 4 while keeping the reference area constant.
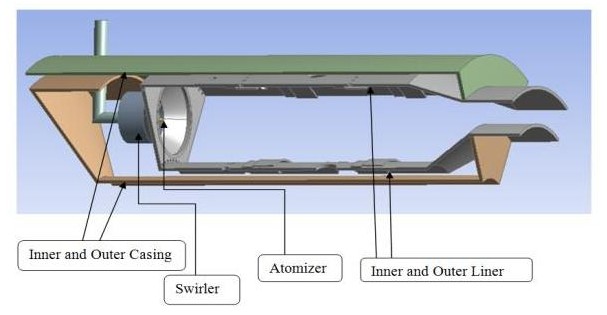
Figure 1: 1/6th CAD model showing combustor liner geometry and key features.
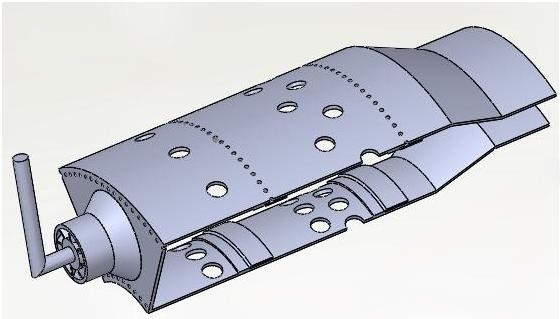
Figure 2: Systematic arrangement of liner holes showing modification pattern across cases.
Liner Hole Area Matrix
The table below summarizes total liner hole area ratio and performance metrics derived from the CFD analysis:
| Case | Total hole ratio A_hole/A_ref |
Total Pressure Loss [%] | Combustion Efficiency [%] | Pattern Factor |
|---|---|---|---|---|
| 1 | 0.3419 | 7.60 | 98.48 | 0.745 |
| 2 | 0.2746 | 8.58 | 99.35 | 0.605 |
| 3 | 0.2341 | 8.75 | 99.59 | 0.508 |
| 4 | 0.2315 | 8.82 | 99.61 | 0.684 |
Numerical Methodology
- Meshing: Unstructured tetrahedral grid, ~4.5M cells per case; symmetry on sector faces.
- Solver: ANSYS Fluent; steady RANS, pressure-based solver.
- Turbulence: Standard k–ε model (validated for diffuser / jet-in-crossflow mixing scenarios).
- Combustion: Non-premixed PDF model with ATF surrogate (
C12H23). - Boundary conditions: Air pressure inlet, fuel mass-flow inlet, pressure outlet; target mass flow matched at exit.
Technical note: The standard k–ε model with a non-premixed PDF closure provides a pragmatic accuracy–cost balance for annular combustors where jet mixing governs macro behavior.
Flow Physics & Mixing
Secondary and dilution jets enter a crossflow with significant momentum ratios. As A_hole decreases, jet velocity increases, producing deeper penetration and stronger shear with the core. Net effect:
- Improved scalar mixing and faster fuel-air homogenization.
- Increased local turbulence and dissipation that can raise total pressure loss.
Thermal Field & Pattern Formation
Primary zone peak temperatures: 2200–2350 K.
Secondary zone: 1800–2100 K.
Exit after dilution: ≈1090–1115 K.
Exit temperature pattern is the cumulative result of:
- Jet momentum and penetration from dilution rows.
- Circumferential phasing between rows.
- Film-cooling interaction near the liner.
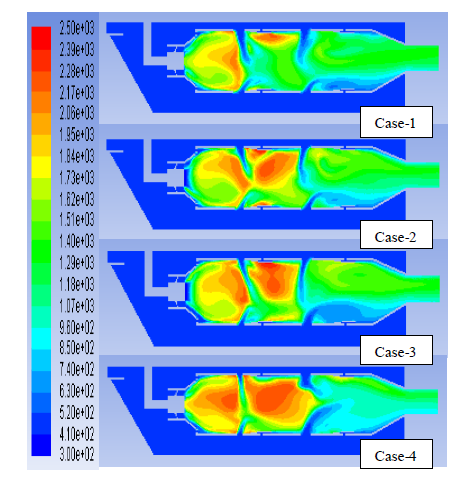
Figure 3: Midplane temperature distribution showing primary, secondary, and dilution zones.
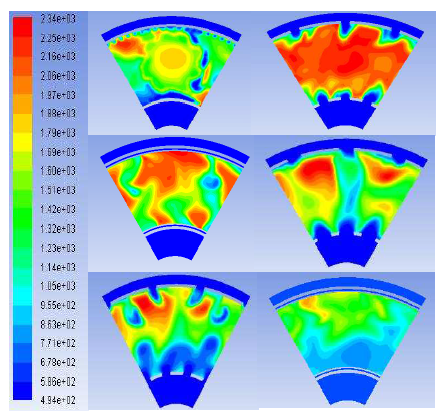
Figure 4: Cross-sectional temperature profiles at key locations:
- Swirler exit & dome cooling holes
- Secondary holes
- First film-cooling holes
- First row of dilution holes
- Second row of dilution holes
- Second film-cooling holes
Performance Results
Total Pressure Loss
Increasing A_hole/A_ref reduces jet velocity and mixing losses, yielding lower total pressure loss. This benefits downstream turbine stage margin and overall cycle specific fuel consumption (SFC).
Combustion Efficiency
Reducing A_hole intensifies turbulence and promotes fuel–air mixing. Computed combustion efficiency rose from ~98.5% (Case 1) to ~99.6% (Case 4). The improvement is fractional but relevant for small turbines where small gains affect range and performance.
Pattern Factor
No monotonic trend with hole area alone. Exit temperature uniformity depends on combustor axial length, dilution-row phasing, and circumferential distribution. Hole area must be co-optimized with placement and timing of dilution jets.
Design Implications & Trade-offs
- Reduce pressure loss: Favor larger
A_holeto lower jet velocities and mixing dissipation. Improves turbine inlet total pressure. - Maximize combustion efficiency: Favor smaller
A_holeto strengthen jet-driven mixing. Monitor penalty in pressure loss. - Control pattern factor: Optimize dilution row axial spacing, circumferential phasing, and combustor length; hole area alone is insufficient.
Future Work
- Parametric sweep of axial and circumferential placement for dilution rows at constant total area.
- Swirler vane-angle optimization to balance recirculation strength vs. total pressure loss.
- Emissions modeling (NOx/CO) across the case matrix for a full performance map.
- Rig testing to validate pressure loss, pattern factor, and liner temperatures.
Conclusion
Liner hole area is a primary design knob in small gas turbine combustors. Larger holes reduce total pressure loss. Smaller holes marginally improve combustion efficiency through enhanced jet-induced turbulence and mixing. Achieving an acceptable exit pattern factor requires coordinated optimization of dilution placement and combustor axial length beyond hole sizing alone.